
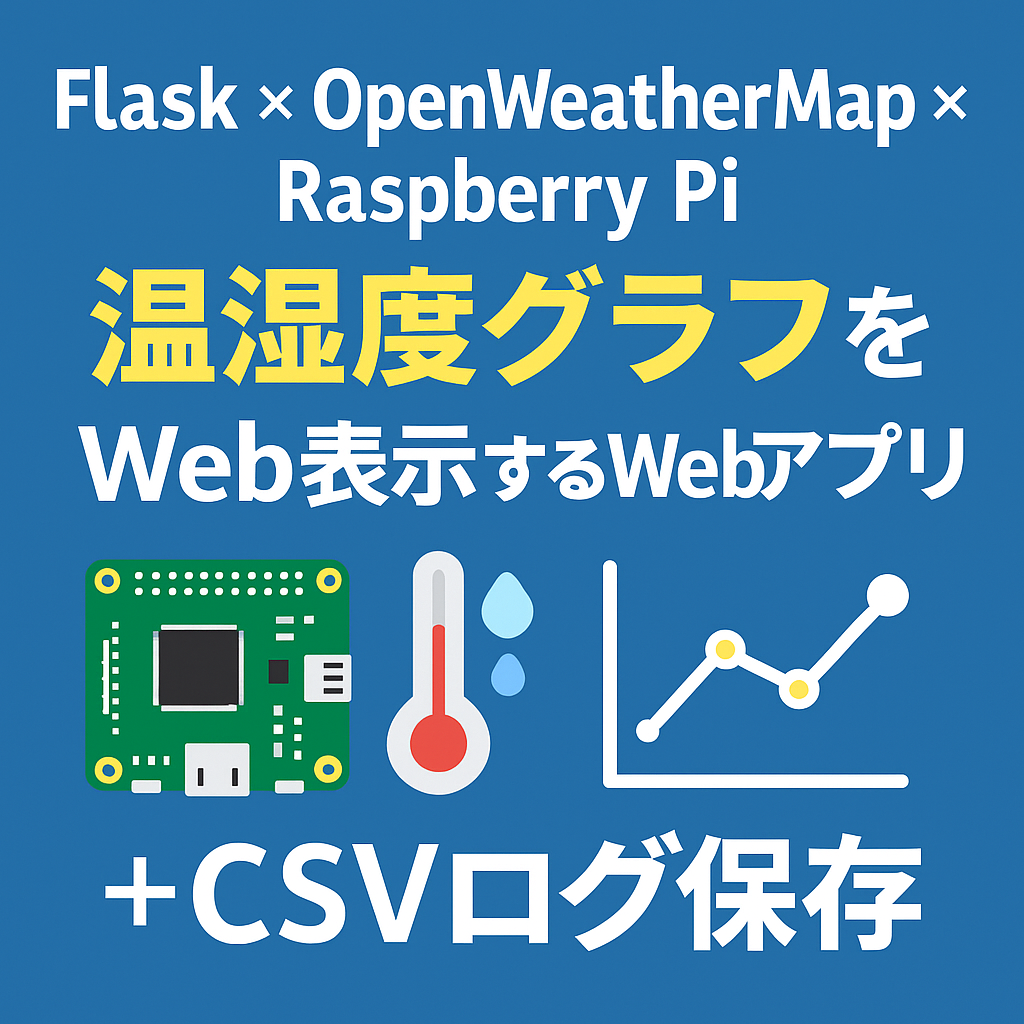
Raspberry Pi で取得した室内の温度・湿度と、OpenWeatherMap の外気天気情報をまとめて表示できる Web アプリを Flask で構築しました。
「Flask×OpenWeatherMap×Raspberry Piで作る!室内温湿度と天気情報を表示するWebアプリ」の拡張版です。
今回、次の2つの機能を追加しています:
✅ Matplotlib グラフ機能(室内+外気 温湿度の推移)
✅ CSV形式のログ保存機能(データ分析・Excel活用に最適)
この記事では、初心者でも動かせるように、
配線・コード・Web画面・仕組みまでていねいに解説します。
この記事で作れるもの
- 室内(DHT20)の温度&湿度表示
- OpenWeatherMap(外気)の気温&湿度表示
- 5分ごとに自動更新
- 温湿度の推移グラフ(室内+外気)
- CSVログ(温湿度を出力)
必要なもの(初心者向け)

SeeedStudio Grove 温湿度センサーV2.0(DHT20)
今回使用する温湿度センサーです。千石電商の方が安い場合もありますので、そちらもご参照下さい。
DHT20 の配線(I2C)
| DHT20 | Raspberry Pi |
|---|---|
| VCC | 3.3V(PIN1) |
| GND | GND(PIN6 など) |
| SDA | GPIO2(PIN3) |
| SCL | GPIO3(PIN5) |
配線例は以前の記事をご参照下さい。
I2Cの有効化:
sudo raspi-config
# Interface Options → I2C → Enable
Webアプリの機能概要
追加した機能①:温湿度グラフ(Matplotlib)
DHT20 と外気データを両方保存し、以下4本の線グラフを表示します:
- 室内温度(DHT20)
- 室内湿度(DHT20)
- 外気温度(OWM)
- 外気湿度(OWM)
グラフは Flask の /plot.png で生成し、テンプレートから <img> として表示します。
追加した機能②:CSVログ保存
DHT20 と OpenWeatherMap の値を、5分ごとに CSV へ追記します。
保存箇所:
logs/env_data.csvCSVの中身例:
timestamp,city,indoor_temp,indoor_humidity,owm_temp,owm_humidity
2025-11-16 12:40:00,Osaka,23.5,45.2,18.1,70
2025-11-16 12:45:00,Osaka,23.6,45.0,18.3,69
Excelで読み込んで統計分析もできます。
Flaskアプリのソースコード
グラフとログ機能を追加したソースコードになります。
#!/usr/bin/env python3
# -*- coding: utf-8 -*-
"""
Flask × OpenWeatherMap × Grove DHT20 (Raspberry Pi)
- 5分ごとにバックグラウンド更新(天気+DHT20)
- 室内温湿度とOpenWeatherMapの気温・湿度をcsv保存
- Matplotlibで4本の線(室内温度/湿度+外気温/湿度)をグラフ表示(/plot.png)
- app.logとは別に logs/env_data.csv に値を追記保存
"""

import os
import re
import time
import json
import uuid
import threading
import csv
import math
from datetime import datetime, timedelta
from collections import deque
from io import BytesIO
from pathlib import Path

import requests
from flask import (
    Flask,
    render_template,
    request,
    flash,
    jsonify,
    g,
    has_request_context,
    send_file,
    url_for,
)

# =========================
# Logging setup
# =========================
import logging
from logging.handlers import RotatingFileHandler

LOG_DIR   = os.getenv("LOG_DIR", "./logs")
LOG_LEVEL = os.getenv("LOG_LEVEL", "INFO").upper()
LOG_JSON  = os.getenv("LOG_JSON", "0") in ("1", "true", "True")
os.makedirs(LOG_DIR, exist_ok=True)

# CSV ログファイル (OpenWeatherMap + DHT20)
DATA_CSV_PATH = Path(os.getenv("DATA_CSV_PATH", str(Path(LOG_DIR) / "env_data.csv")))
DATA_CSV_PATH.parent.mkdir(parents=True, exist_ok=True)

class ApiKeyMaskingFilter(logging.Filter):
    """URLやparamsにAPIキーが混入した場合にマスクする(二重フォーマット抑止)"""
    _re = re.compile(r'(?i)(appid|api_key|apikey)=([A-Za-z0-9_\-]+)')

    def filter(self, record: logging.LogRecord) -> bool:
        # 1) まず安全に「この場で」文字列へ整形する
        try:
            if record.args:
                try:
                    msg_text = str(record.msg) % record.args
                except Exception:
                    msg_text = f"{record.msg} | args={record.args}"
            else:
                msg_text = str(record.msg)
        except Exception:
            msg_text = str(record.msg)

        # 2) マスク
        masked = self._re.sub(r"\1=****", msg_text)

        # 3) 再フォーマットを防ぐ
        record.msg = masked
        record.args = ()
        return True

class RequestContextFilter(logging.Filter):
    """Flask コンテキストがある時だけ request 情報を付与。無ければ '-' をセット。"""
    def filter(self, record: logging.LogRecord) -> bool:
        if has_request_context():
            record.request_id = getattr(g, "request_id", "-")
            record.client_ip  = getattr(g, "client_ip", request.headers.get("X-Forwarded-For", request.remote_addr))
            record.city       = getattr(g, "city_for_log", (request.form.get("city") or request.args.get("city") or "-"))
        else:
            record.request_id = "-"
            record.client_ip  = "-"
            record.city       = "-"
        return True

def _json_formatter(record: logging.LogRecord) -> str:
    payload = {
        "ts": datetime.utcnow().strftime("%Y-%m-%dT%H:%M:%S.%fZ"),
        "level": record.levelname,
        "name": record.name,
        "msg": record.getMessage(),
        "request_id": getattr(record, "request_id", "-"),
        "client_ip": getattr(record, "client_ip", "-"),
        "city": getattr(record, "city", "-"),
    }
    if record.exc_info:
        payload["exc"] = logging.Formatter().formatException(record.exc_info)
    return json.dumps(payload, ensure_ascii=False)

class JsonFormatter(logging.Formatter):
    def format(self, record: logging.LogRecord) -> str:
        return _json_formatter(record)

def setup_logging():
    logger = logging.getLogger()
    logger.setLevel(getattr(logging, LOG_LEVEL, logging.INFO))
    for h in list(logger.handlers):
        logger.removeHandler(h)

    mask = ApiKeyMaskingFilter()
    ctx  = RequestContextFilter()

    ch = logging.StreamHandler()
    if LOG_JSON:
        ch.setFormatter(JsonFormatter())
    else:
        fmt = "%(asctime)s [%(levelname)s] %(name)s [req:%(request_id)s ip:%(client_ip)s city:%(city)s] %(message)s"
        ch.setFormatter(logging.Formatter(fmt, datefmt="%Y-%m-%d %H:%M:%S"))
    ch.addFilter(mask); ch.addFilter(ctx)
    logger.addHandler(ch)

    fh = RotatingFileHandler(
        os.path.join(LOG_DIR, "app.log"),
        maxBytes=5*1024*1024,
        backupCount=5,
        encoding="utf-8"
    )
    if LOG_JSON:
        fh.setFormatter(JsonFormatter())
    else:
        fh.setFormatter(logging.Formatter(fmt, datefmt="%Y-%m-%d %H:%M:%S"))
    fh.addFilter(mask); fh.addFilter(ctx)
    logger.addHandler(fh)

    logging.getLogger("urllib3").setLevel(logging.WARNING)
    logging.getLogger("werkzeug").setLevel(logging.INFO)

setup_logging()
logger = logging.getLogger("weather_app")
logger.info("logger initialized")

# =========================
# Matplotlib
# =========================
import matplotlib
matplotlib.use("Agg")
import matplotlib.pyplot as plt

# =========================
# DHT20 (Grove) driver
# =========================
try:
    from smbus2 import SMBus, i2c_msg
except Exception:
    SMBus = None  # 非ラズパイ環境でも起動できるように

DHT20_ADDR = 0x38
I2C_BUS_NO = int(os.getenv("I2C_BUS", "1"))

def dht20_read(max_retries: int = 3, timeout_s: float = 0.15):
    """DHT20から (temperature_C, humidity_RH) を取得。失敗時は (None, None)。"""
    if SMBus is None:
        logger.debug("SMBus not available; skip DHT20 read")
        return (None, None)
    try:
        with SMBus(I2C_BUS_NO) as bus:
            for _ in range(10):
                status = bus.read_byte(DHT20_ADDR)
                busy = (status & 0x80) != 0
                cal  = (status & 0x08) != 0
                if (not busy) and cal:
                    break
                time.sleep(0.05)

            for attempt in range(max_retries):
                bus.write_i2c_block_data(DHT20_ADDR, 0xAC, [0x33, 0x00])
                time.sleep(timeout_s)

                read = i2c_msg.read(DHT20_ADDR, 7)
                bus.i2c_rdwr(read)
                data = list(read)
                if len(data) != 7:
                    logger.warning("DHT20 read len=%s (attempt %s)", len(data), attempt+1)
                    continue

                raw_h = ((data[1] << 12) | (data[2] << 4) | (data[3] >> 4)) & 0xFFFFF
                raw_t = (((data[3] & 0x0F) << 16) | (data[4] << 8) | data[5]) & 0xFFFFF
                humidity = raw_h * 100.0 / (2**20)
                temperature = raw_t * 200.0 / (2**20) - 50.0

                if -40.0 <= temperature <= 85.0 and 0.0 <= humidity <= 100.0:
                    t, h = round(temperature, 2), round(humidity, 2)
                    logger.debug("DHT20 ok temp=%.2fC rh=%.2f%%", t, h)
                    return (t, h)
        logger.error("DHT20 read failed")
        return (None, None)
    except Exception:
        logger.exception("DHT20 exception")
        return (None, None)

# =========================
# OpenWeatherMap
# =========================
OWM_API_KEY = os.getenv("OPENWEATHER_API_KEY", " ")
OWM_BASE = "https://api.openweathermap.org/data/2.5/weather"

def fetch_weather(city: str, lang: str = "ja", units: str = "metric"):
    """OpenWeatherMap 現在天気を取得。SSLエラーなども握りつぶしてアプリを落とさない。"""
    if not OWM_API_KEY:
        return {"ok": False, "error": "OPENWEATHER_API_KEY が未設定です。"}

    params = {"q": city, "appid": OWM_API_KEY, "units": units, "lang": lang}
    try:
        r = requests.get(OWM_BASE, params=params, timeout=8)
        r.raise_for_status()
    except requests.exceptions.SSLError as e:
        logger.warning("OWM SSL error city=%s err=%s", city, e)
        return {"ok": False, "error": "天気APIへのSSL接続でエラーが発生しました。(ネットワーク/TLS設定を確認してください)"}
    except requests.exceptions.RequestException as e:
        logger.warning("OWM request error city=%s err=%s", city, e)
        return {"ok": False, "error": f"天気APIへの接続に失敗しました: {e}"}

    try:
        data = r.json()
    except ValueError:
        logger.warning("OWM invalid JSON city=%s", city)
        return {"ok": False, "error": "天気APIから不正な応答が返されました。"}

    return {
        "ok": True,
        "city": data.get("name", city),
        "temp": data.get("main", {}).get("temp"),
        "feels": data.get("main", {}).get("feels_like"),
        "humidity": data.get("main", {}).get("humidity"),
        "desc": data.get("weather", [{}])[0].get("description"),
        "icon": data.get("weather", [{}])[0].get("icon"),
        "wind": data.get("wind", {}).get("speed"),
        "raw": data,
    }

# =========================
# 室内+外気の履歴(グラフ用)&CSV
# =========================
HISTORY_MAX_POINTS = int(os.getenv("HISTORY_MAX_POINTS", "288"))  # 5分×24時間
STATE_LOCK = threading.Lock()
DATA_LOCK  = threading.Lock()
CSV_LOCK   = threading.Lock()

# 共有STATE
STATE = {
    "city": "Osaka",
    "weather": {"ok": False, "error": "未取得"},
    "sensor": {"ok": False, "temp_c": None, "humidity": None, "note": None},
    "updated_at": None,
    "next_at": None,
}

# 履歴 (timestamp, indoor_temp, indoor_hum, owm_temp, owm_hum)
HISTORY = deque(maxlen=HISTORY_MAX_POINTS)

def add_history(ts: datetime, indoor_t, indoor_h, owm_t, owm_h):
    with DATA_LOCK:
        HISTORY.append((ts, indoor_t, indoor_h, owm_t, owm_h))

def get_history():
    with DATA_LOCK:
        return list(HISTORY)

def append_csv(ts: datetime, city: str, indoor_t, indoor_h, owm_t, owm_h):
    """env_data.csv に1行追記。存在しなければヘッダ付きで作成。"""
    row = [
        ts.strftime("%Y-%m-%d %H:%M:%S"),
        city,
        "" if indoor_t is None else indoor_t,
        "" if indoor_h is None else indoor_h,
        "" if owm_t is None else owm_t,
        "" if owm_h is None else owm_h,
    ]
    header = ["timestamp", "city", "indoor_temp", "indoor_humidity", "owm_temp", "owm_humidity"]

    with CSV_LOCK:
        file_exists = DATA_CSV_PATH.exists()
        with DATA_CSV_PATH.open("a", newline="", encoding="utf-8") as f:
            writer = csv.writer(f)
            if not file_exists:
                writer.writerow(header)
            writer.writerow(row)

def update_once():
    """現在CITYの天気とDHT20を取得してSTATE+履歴+CSVに保存。"""
    with STATE_LOCK:
        city = STATE["city"]

    weather = fetch_weather(city)
    t, rh = dht20_read()

    sensor = {
        "ok": (t is not None and rh is not None),
        "temp_c": t,
        "humidity": rh,
        "note": None if (t is not None) else "DHT20未検出/I2C未設定の可能性",
    }

    owm_temp = weather.get("temp") if weather.get("ok") else None
    owm_hum  = weather.get("humidity") if weather.get("ok") else None

    now = datetime.now()
    nxt = now + timedelta(minutes=5)

    with STATE_LOCK:
        STATE.update({
            "weather": weather,
            "sensor": sensor,
            "updated_at": now,
            "next_at": nxt,
        })

    # 履歴とCSV
    add_history(now, t, rh, owm_temp, owm_hum)
    append_csv(now, city, t, rh, owm_temp, owm_hum)

    logger.info("update_once city=%s weather_ok=%s sensor_ok=%s",
                city, weather.get("ok"), sensor["ok"])

def scheduler_loop(stop_event: threading.Event):
    """5分ごとに update_once() を実行。"""
    update_once()  # 起動直後1回
    while not stop_event.wait(300):  # 300秒=5分
        update_once()

# =========================
# Flask app
# =========================
app = Flask(__name__)
app.secret_key = os.getenv("FLASK_SECRET_KEY", "dev-secret")

@app.before_request
def _before():
    g.request_id = uuid.uuid4().hex[:8]
    g.t0 = time.perf_counter()
    g.client_ip = request.headers.get("X-Forwarded-For", request.remote_addr)
    g.city_for_log = (request.form.get("city") or request.args.get("city") or "-").strip() or "-"

@app.after_request
def _after(resp):
    dt_ms = int((time.perf_counter() - g.get("t0", time.perf_counter())) * 1000)
    logger.info("access %s %s %s %dms", request.method, request.path, resp.status_code, dt_ms)
    return resp

# スケジューラ開始
_stop = threading.Event()
_thr = threading.Thread(target=scheduler_loop, args=(_stop,), daemon=True)
_thr.start()

@app.route("/", methods=["GET", "POST"])
def index():
    if request.method == "POST":
        new_city = (request.form.get("city") or "").strip()
        if new_city:
            with STATE_LOCK:
                STATE["city"] = new_city
            logger.info("city changed -> %s (immediate update)", new_city)
            update_once()

    with STATE_LOCK:
        city = STATE["city"]
        weather = STATE["weather"]
        sensor = STATE["sensor"]
        updated_at = STATE["updated_at"]
        next_at = STATE["next_at"]

    if not weather.get("ok"):
        flash(weather.get("error") or "天気情報の取得に失敗しました。", "error")

    history_len = len(get_history())
    plot_url = url_for("plot_png", t=datetime.now().strftime("%Y%m%d%H%M%S"))

    return render_template(
        "index.html",
        city=city,
        weather=weather,
        sensor=sensor,
        updated_at=updated_at,
        next_at=next_at,
        plot_url=plot_url,
        history_len=history_len,
        history_interval_sec=300,
        csv_path=str(DATA_CSV_PATH),
    )

@app.route("/api/latest")
def api_latest():
    with STATE_LOCK:
        payload = {
            "city": STATE["city"],
            "weather": STATE["weather"],
            "sensor": STATE["sensor"],
            "updated_at": STATE["updated_at"].strftime("%Y-%m-%d %H:%M:%S") if STATE["updated_at"] else None,
            "next_at": STATE["next_at"].strftime("%Y-%m-%d %H:%M:%S") if STATE["next_at"] else None,
        }
    return jsonify(payload)

@app.route("/plot.png")
def plot_png():
    """室内+外気の温湿度履歴をグラフにしてPNGで返す。"""
    history = get_history()
    if not history:
        fig, ax = plt.subplots(figsize=(6, 3))
        ax.text(0.5, 0.5, "No data yet", ha="center", va="center")
        ax.axis("off")
    else:
        times = [h[0] for h in history]
        in_t  = [h[1] if h[1] is not None else math.nan for h in history]
        in_h  = [h[2] if h[2] is not None else math.nan for h in history]
        out_t = [h[3] if h[3] is not None else math.nan for h in history]
        out_h = [h[4] if h[4] is not None else math.nan for h in history]

        fig, ax1 = plt.subplots(figsize=(8, 4))

        # 温度(左軸)
        ax1.plot(times, in_t,  label="Indoor temp. (°C)")
        ax1.plot(times, out_t, label="Outside temp. (°C)", linestyle="--", color="green")
        ax1.set_xlabel("Time")
        ax1.set_ylabel("Temperature (°C)")
        ax1.grid(True)

        # 湿度(右軸)
        ax2 = ax1.twinx()
        ax2.plot(times, in_h,  label="Indoor humidity (%)")
        ax2.plot(times, out_h, label="Outside humidity (%)", linestyle="--")
        ax2.set_ylabel("Humidity (%)")

        # 凡例
        lines, labels = ax1.get_legend_handles_labels()
        lines2, labels2 = ax2.get_legend_handles_labels()
        ax1.legend(lines + lines2, labels + labels2, loc="best")

        fig.autofmt_xdate()
        fig.tight_layout()

    buf = BytesIO()
    plt.savefig(buf, format="png")
    plt.close(fig)
    buf.seek(0)
    return send_file(buf, mimetype="image/png")

if __name__ == "__main__":
    try:
        host = os.getenv("FLASK_HOST", "0.0.0.0")
        port = int(os.getenv("FLASK_PORT", "5000"))
        app.run(host=host, port=port, debug=True)
    finally:
        _stop.set()
        _thr.join(timeout=1.0)
ポイントだけ解説
バックグラウンドで5分ごとに取得
def scheduler_loop(stop_event):
    update_once()  # 起動直後
    while not stop_event.wait(300):
        update_once()
履歴を保持(deque)
HISTORY = deque(maxlen=288) # 24時間分(5分×288)CSVログへの書き込み
append_csv(now, city, indoor_temp, indoor_hum, owm_temp, owm_hum)グラフ生成(Matplotlib)
fig, ax1 = plt.subplots(figsize=(8, 4))
ax1.plot(times, in_t, label="室内温度")
ax1.plot(times, out_t, label="外気温度", linestyle="--")
Web UI(Flaskテンプレート)
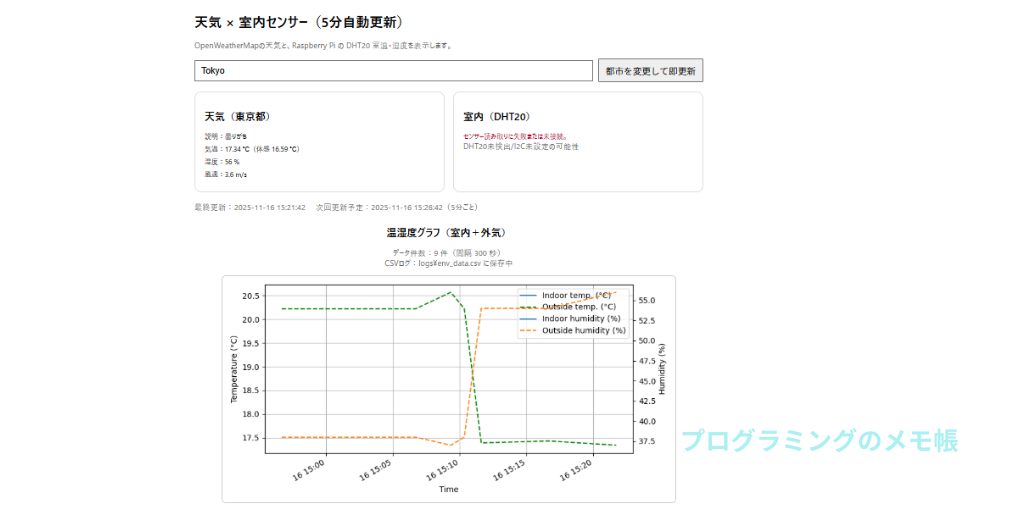
UIには以下を表示:
- 天気情報(気温・湿度・体感温度・風速)
- 室内温湿度(DHT20)
- 最終更新時刻
- 温湿度グラフ(中央配置)
- CSVログ保存場所
「Flask×OpenWeatherMap×Raspberry Piで作る!室内温湿度と天気情報を表示するWebアプリ」のHTMLを変更します。
変更①:CSS を追加
<style> の中に、次を追加します(どこに入れてもOK):
    .graph-wrap {
      text-align: center;
      margin-top: 24px;
    }
    .graph-wrap img {
      max-width: 100%;
      border: 1px solid #ccc;
      border-radius: 8px;
      display: inline-block;
    }
変更②:グラフ部分を .wrap の中に入れてセンタリング
以下を .wrap の中に入れて、graph-wrap で囲みます。
  <p class="muted" style="margin-top: 16px;">
    最終更新:{{ updated_at.strftime("%Y-%m-%d %H:%M:%S") if updated_at else "—" }}
    次回更新予定:{{ next_at.strftime("%Y-%m-%d %H:%M:%S") if next_at else "—" }}(5分ごと)
  </p>

  <!-- ここからグラフ -->
  <div class="graph-wrap">
    <h2>温湿度グラフ(室内+外気)</h2>
    <p class="muted">
      データ件数:{{ history_len }} 件(間隔 {{ history_interval_sec }} 秒)<br>
      CSVログ:{{ csv_path }} に保存中
    </p>
    <img src="{{ plot_url }}" alt="温湿度グラフ">
  </div>
</div>  <!-- ← .wrap の閉じタグはここ -->
</body>
</html>
トラブルシューティング
| 症状 | 原因 | 対策 |
|---|---|---|
| OpenWeatherMap がエラー | TLS/SSL 失敗 or WiFi不安定 | ラズパイの時計・証明書を更新 |
| グラフが表示されない | データ不足 | 5〜10分待つ |
| DHT20 が取得できない | I2C未有効化 or 配線ミス | sudo raspi-config で有効化 |
| CSVが増えない | 取得に失敗 | ログ env_data.csv を確認 |
まとめ:「家庭用ミニ環境モニタ」の完成形!
今回のアプリは、以下の機能をすべて実現しています:
- 室内温湿度(DHT20)
- 外気温湿度(OpenWeatherMap)
- 5分ごとに自動更新
- 履歴グラフ(Matplotlib)
- CSVログ保存(Excel分析用)
- Flaskで簡易Webダッシュボード
実際にIoTもどきのシステムを作成してみました。ゆくゆくは、スマホ通知や他のセンサも追加して、実用的なものにしていきます。
追記
Matplotlibでのグラフ表示を数日間行いましたが、途中で画面表示が止まってました。原因はプロット数にありそうです。Logの方は問題なく取得し続けていたので、上記のMatplotlibからJSに変更したものを別途記事に上げます。
ご意見、ご相談等ありましたら、お問い合わせからお願い致します。